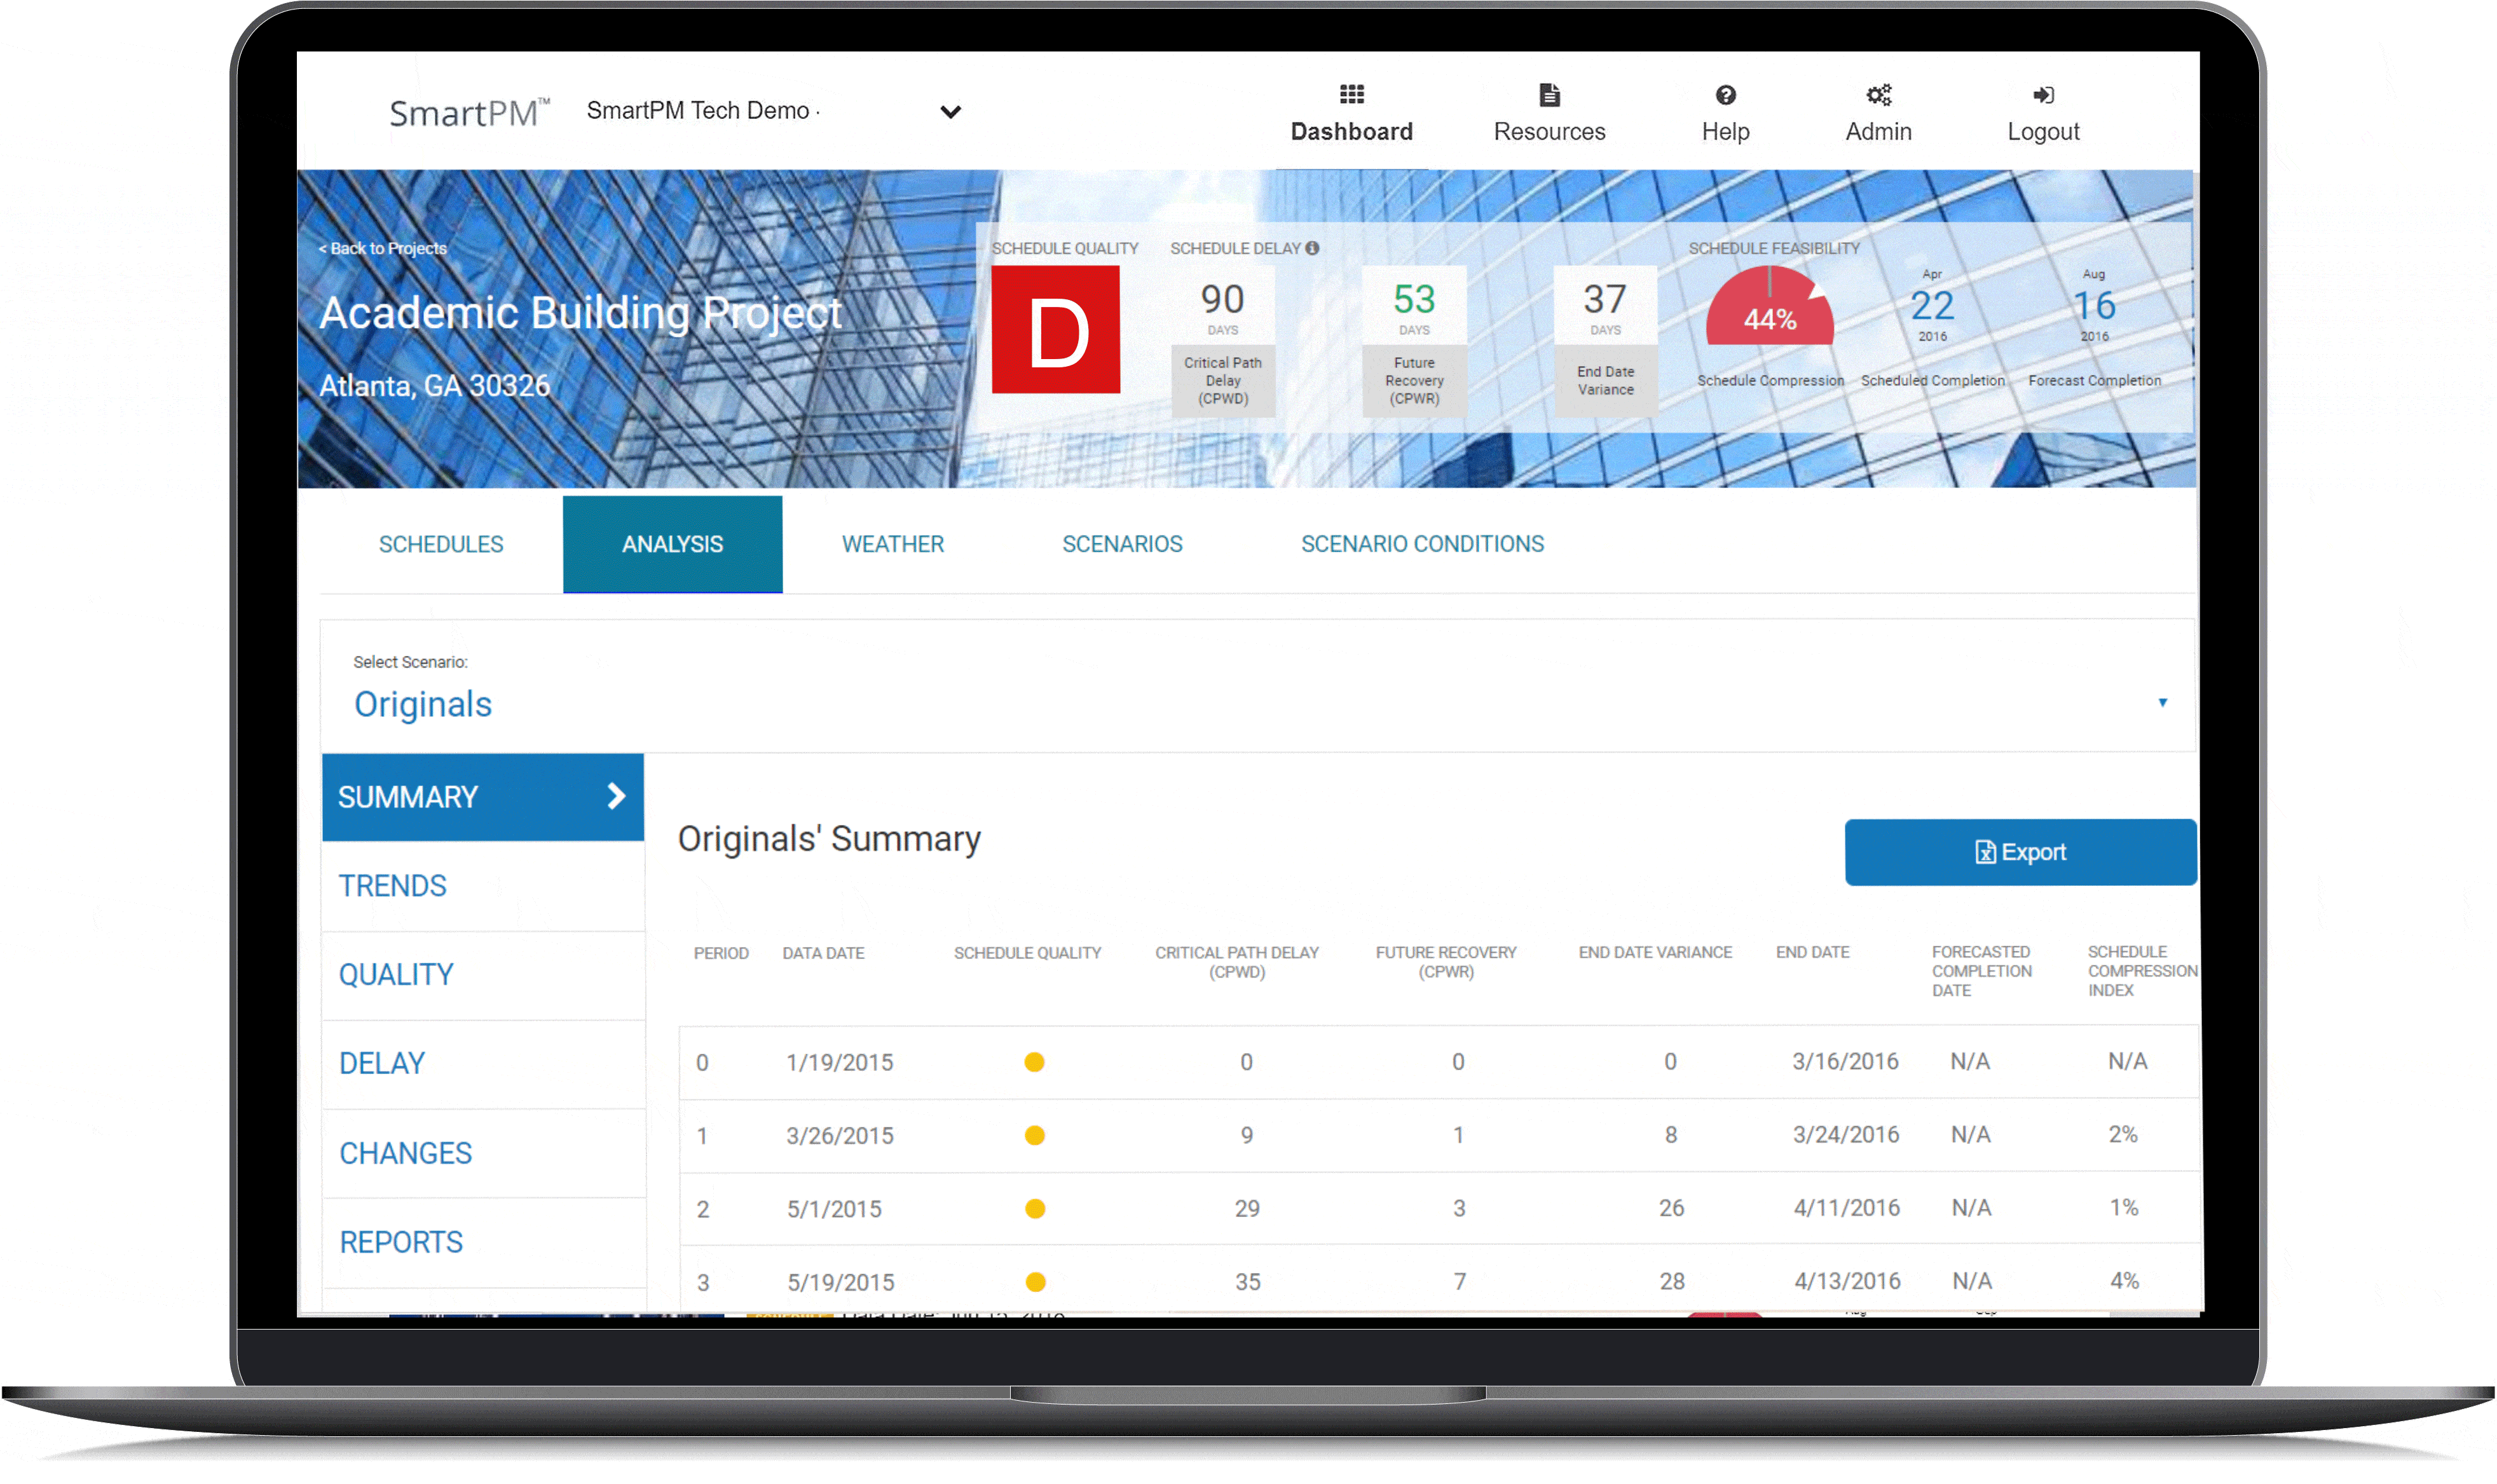
SmartPM Project Dashboard
SmartPM Project Dashboard
SmartPM™ is a full-scale scheduling analytics platform.
Click the schedule link to open the schedule update in a traditional Gantt Chart view like Primavera or MS Project.
From here you can roll up your sleeves and drill down into your schedule.
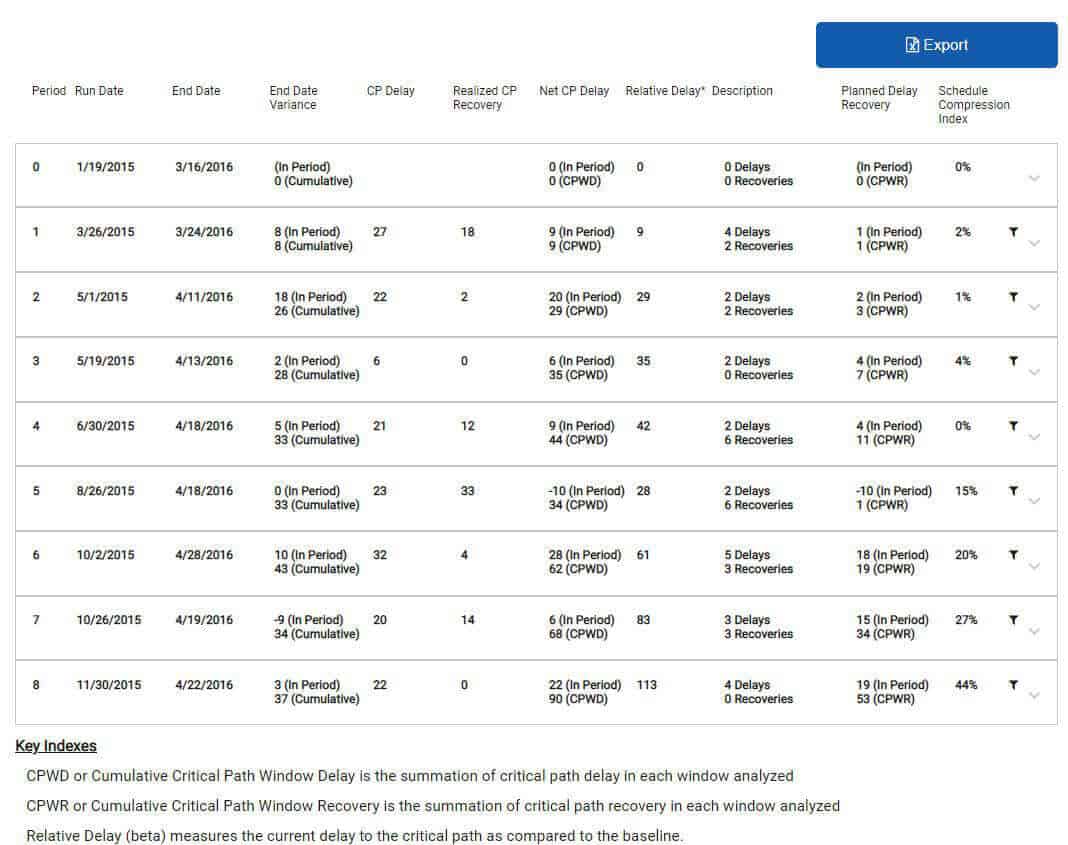
Delay
View the results of SmartPM’s automatic Historical Critical Path analysis here. The Delay Table provides you an auto generated Windows Analysis; letting you know exactly what activities were delayed, recovered, and where you stand moving forward.
Click to enlarge
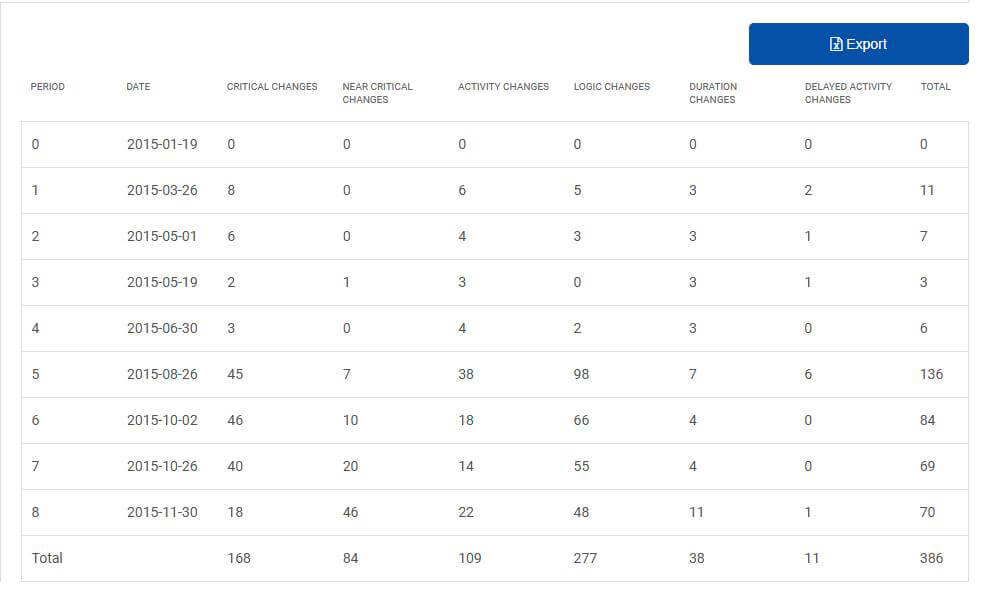
Changes
Better understand the various modifications made from one schedule update to another. SmartPM™ maintains a running log of changes and dates for these changes. SmartPM™ then distills these changes to filter those changes that had a direct impact on the go-forward critical and near critical paths.
Click to enlarge
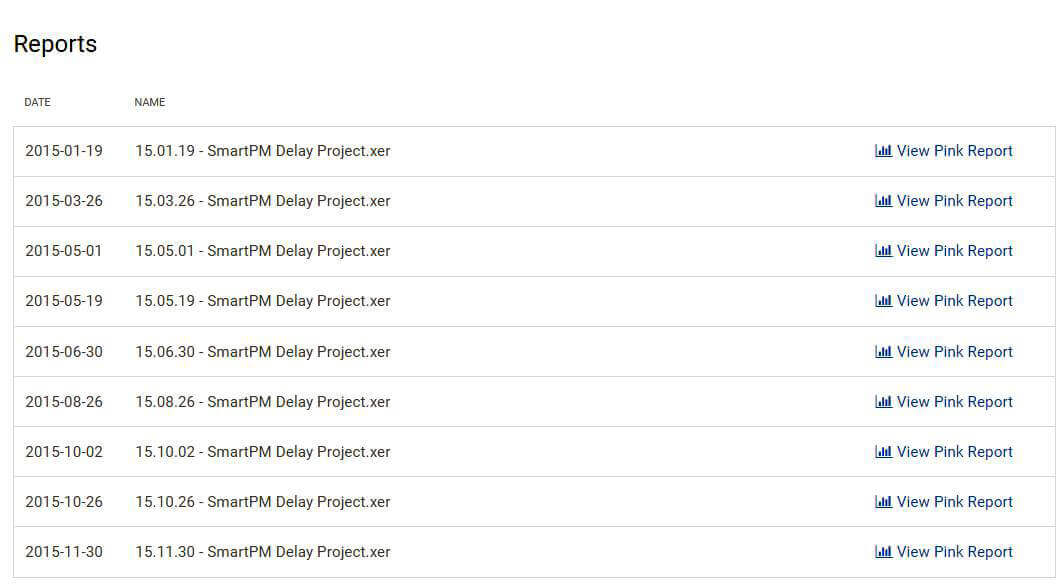
Reports
The Reports tab is your digital filing cabinet for each one of your executive level Pink Reports. From here you can customize your Pink Report for any schedule update uploaded into SmartPM™. The Pink Report is an executive summary of the project to date that empowers you with the information you need in order to have the appropriate conversations with key stakeholders, making OAC meetings more efficient, productive and meaningful.
Click to enlarge
Quality
Review SmartPM’s analysis of your Project’s schedule quality. Here you will be able to review how well your schedules have been built, where the trouble spots are, and understand why & how they can be improved in an easy to read format.
Click to enlarge
Schedules Tab
Click the schedule link to open the schedule update in a traditional Gantt Chart view like Primavera or MS Project.
From here you can roll up your sleeves and drill down into your schedule.
Click to Enlarge
Click to Enlarge
Trends
Click to enlarge


Schedule Quality
The schedule quality metric evaluates the structural integrity of you schedule and takes into factor key industry standard metrics to determine whether or not the schedule is structurally sound and feasible.
This metric is key to ensure that your project’s schedule is sufficient to manage the project. It is important to review the Schedule Quality throughout the entire project to ensure that the integrity is not compromised as the project progresses increasing the risk of delays and overruns.
Click to enlarge
Critical Path Delay
Identifying Historical Critical Path and calculating is one of the most challenging calculations in all of construction and we have automated it!
This metric tells you how many days of actual critical path delay the project has suffered to date. Behind this metric is an in depth delay analysis complete with a delay table and schedule summary that review, analyze and/or drill down on.
Recovery
The future recovery of a schedule captures the remediation efforts that have been put in place by the scheduler in order to recover time from the delays that have occurred thus far and bring the project completion date back in.
This is done by manipulating activity durations and logical structure of the schedule. It is very important to validate this feasibility of these changes in order to not jeopardize the future of the project.
End-Date Variance
The end date variance of a schedule captures the diversion of the current schedule completion date from the baseline schedule completion date.
If the schedule was to progress as shown in the latest schedule update, the schedule will complete this many days later than originally planned.
Compression
The schedule compression captures the amount of effort remaining in the schedule as compared to the baseline.
A high schedule compression reduces the feasibility of completing the project on time, unless realistic future recovery has been put in place
Scheduled vs. Forecasted
Completion Dates
SmartPM's forecasted completion date uses a proprietary AI based algorithm based on current progress to give a realistic estimate of what the completion date of the schedule should be given things progress as they have thus far.
The scheduled completion date shows the completion date based on the current schedule update.
Summary
View a summary of all project schedules uploaded to the project.
Click to enlarge
