Automated Project Controls™ Dashboard
Streamline your construction project management with SmartPM’s Automated Project Controls Dashboard. It integrates enriched data, smart analysis, and actionable insights into your system, enabling you to efficiently manage schedules, control costs, and boost profitability with ease.
Automated Project Controls™ Dashboard
Click on Any Dashboard Element for Detailed Descriptions
Project Dashboard
Gain unparalleled insights into your projects with SmartPM™. Our best-in-class schedule analytics give you the ability to quickly assess critical factors driving your projects, giving you more time to focus on proactive project management and risk mitigation.
Schedule Quality Index™
Schedule Compression Index™
Project Health Index™
Schedule Performance Index™

Delayed Projects
.

The Number of Projects Delayed in the Current Portfolio of Projects in SmartPM. A Delayed Project is a project where the current planned completion date of the project is on a later date than the planned completion date in the projects assigned “baseline” schedule.
Projects with low quality schedules
.

The Number of Projects with Low Quality Schedules in the Current Portfolio of Projects in SmartPM. A Low Quality Schedule is a schedule that has a C or lower “grade” as compared to the customizable DCMA driven schedule quality index set up by the user.
Projects that need new schedules
.

The number of projects that need new schedules – or have not received an updated schedule since a month prior to the current date.
Projects on track
.

The number of projects on track in the current portfolio of projects in SmartPM. An "on track project" is defined as a project that has a current planned completion date on a date before the planned completion date of the current projects “assigned” baseline schedule.
Project Name

Title of Project's Scenario Base
.

The title of the Projects Scenario "August 2015 Baseline" – is the name given to the scenario that the user has set to be present on the dashboard.
Days Delayed
.

The current number of calendar days that a project's end date is delayed as compared to the planned completion date of the project's assigned baseline schedule.
Data Dates
.

Data Date is the status date of the most recent schedule update imported into SmartPM for a specific project.
Baseline End Date is the end date in your baseline schedule.
Current End Date is the end date in your most current schedule
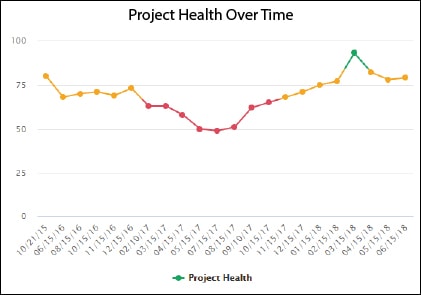
Project Health Index™
.

The Project Health Index™ is a gauge of overall project health taking into account the other project performance and risk metrics visible on the dashboard- including schedule quality, feasibility, progress delay and historical performance.
Schedule Performance Index™
.

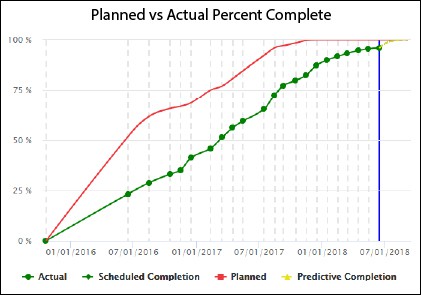
The Schedule Delay Section of the dashboard houses the KPI’s related to performance including Planned vs Actual, Schedule Performance Index™ (SPI), Critical Path Delay (if any), and Planned Future Acceleration as per the latest schedule update.
Critical Path Delay
.

The Critical Path Delay Metric is a calculation of total cumulative critical path delay a project has suffered, as quantified in each update period and added together over time.
Future Acceleration/Recovery
.

The Future Acceleration Metric is a calculation of the total cumulative acceleration that has been built into the schedule through the contemporaneous project updates, as quantified in each update period and added up over time.
Schedule Quality Index™
.

The Schedule Quality Index™ is a gauge of the structural integrity of a project schedule, using a customized scoring model that leverages the DCMA methodology.
Schedule Compression Index™
.

The Schedule Compression Index™ is a comparison of compression that has been built into a schedule at a given point in time – as compared to the original baseline schedule
Forecasted Completion

The forecasted completion date is SmartPM's estimated completion date if your performance continues as is. SmartPM looks at performance, compression, and delays, in order to determine how far off your current scheduled completion date.
This should be seen as a metric to help you determine if your schedule is overly aggressive or if you have feasible recovery (acceleration) plans in place to get your end date inline with your current scheduled end date.
Add Schedule
.

The Add New Project button enables the user to add a new project by importing a new project schedule, deeming it the “baseline” schedule.
View Trends

Trends provides access to key schedule performance metrics over time, allowing users to detect departures from the plan and identify warning signs before a project takes a turn for the worse.
Click to Enlarge
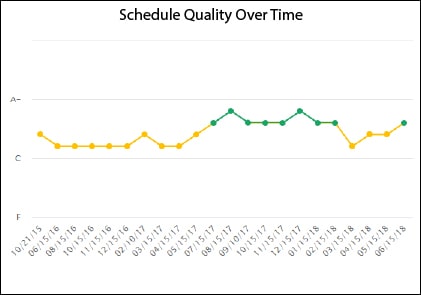
Schedule Quality Over Time- Graphical Depiction of Schedule Quality over Time; Great place to catch problems before its too late.
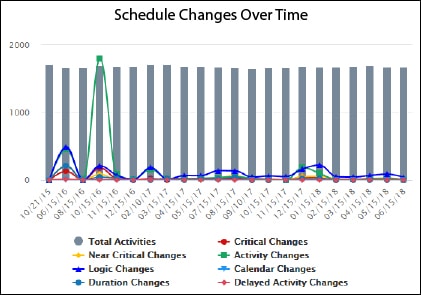
Schedule Changes Over Time- Graphical Analysis of Schedule Modifications over time, broken into categories. This is great to view alongside progress, delay and especially compression trends.
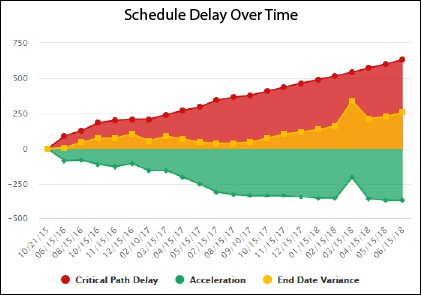
Schedule Delay Over Time- Compares Cumulative Critical Path Delay over time to end date variance over time. This is useful in determining if delays are being swept under the rug!
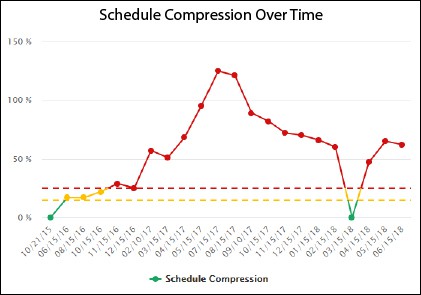
Schedule Compression Over Time- Analysis of schedule compression over time resulting from delays, schedule modifications and lack of planned progress.
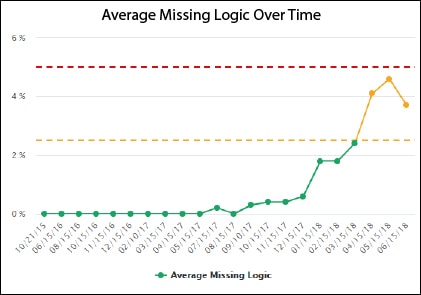
Average Missing Logic Over Time- Graphical depiction of the frequency of missing logic in the schedule over time (aka - the greatest contributor to schedule risk known to man).

Average Activity Total Float Over Time- This is a gauge of whether or not float is being created or consumed over time in schedules; both of which are risk issues.
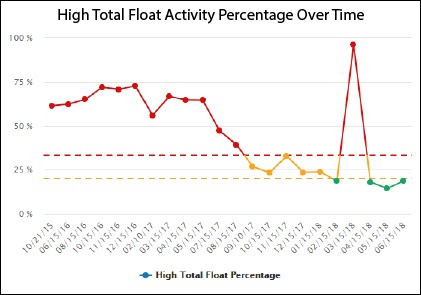
High Total Float Activity Over Time- Evaluates % of activities that contain over 2 months of float in schedule which is an indicator of a schedule that lacks completed logic.
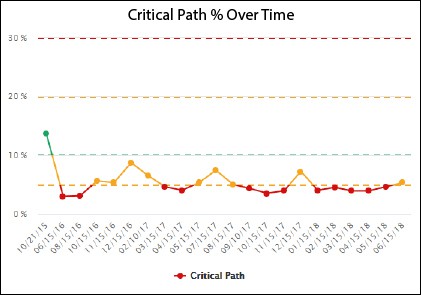
Critical Path % Over Time- A healthy number of critical path activities indicates a schedule that has been built with best practices
Summary Report
.

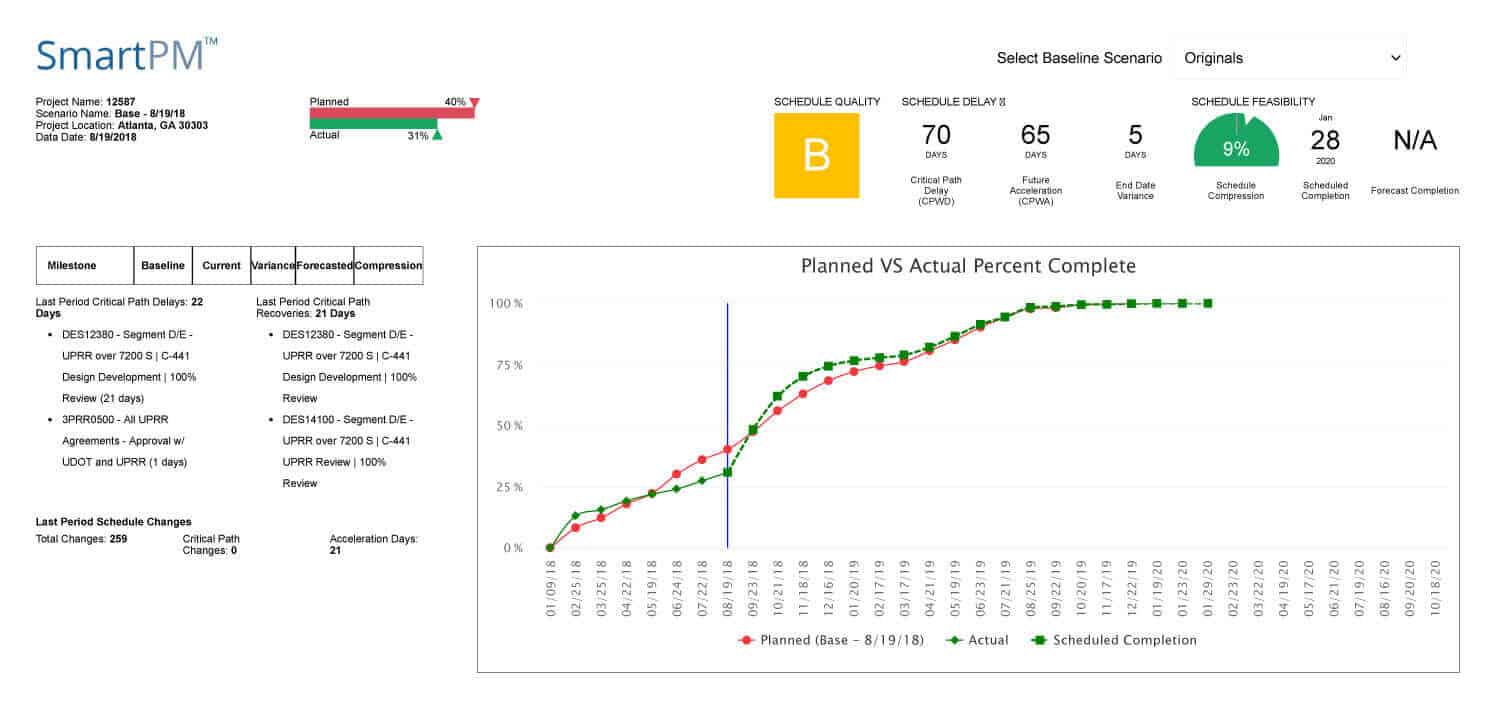
The Summary Report link, when clicked, results in a summary level report (1 pager) popping up on the screen that houses a detailed analysis of performance in the last update period in a condensed format. In this report, the user will be able to assess performance, delay and compression on multiple project milestones, be able to view a planned versus actual performance curve as well as a future planned versus predictive performance curves. In addition, critical path delays and recovery activities will be highlighted, for the previous update period.
Click to enlarge
SmartPM Report
.

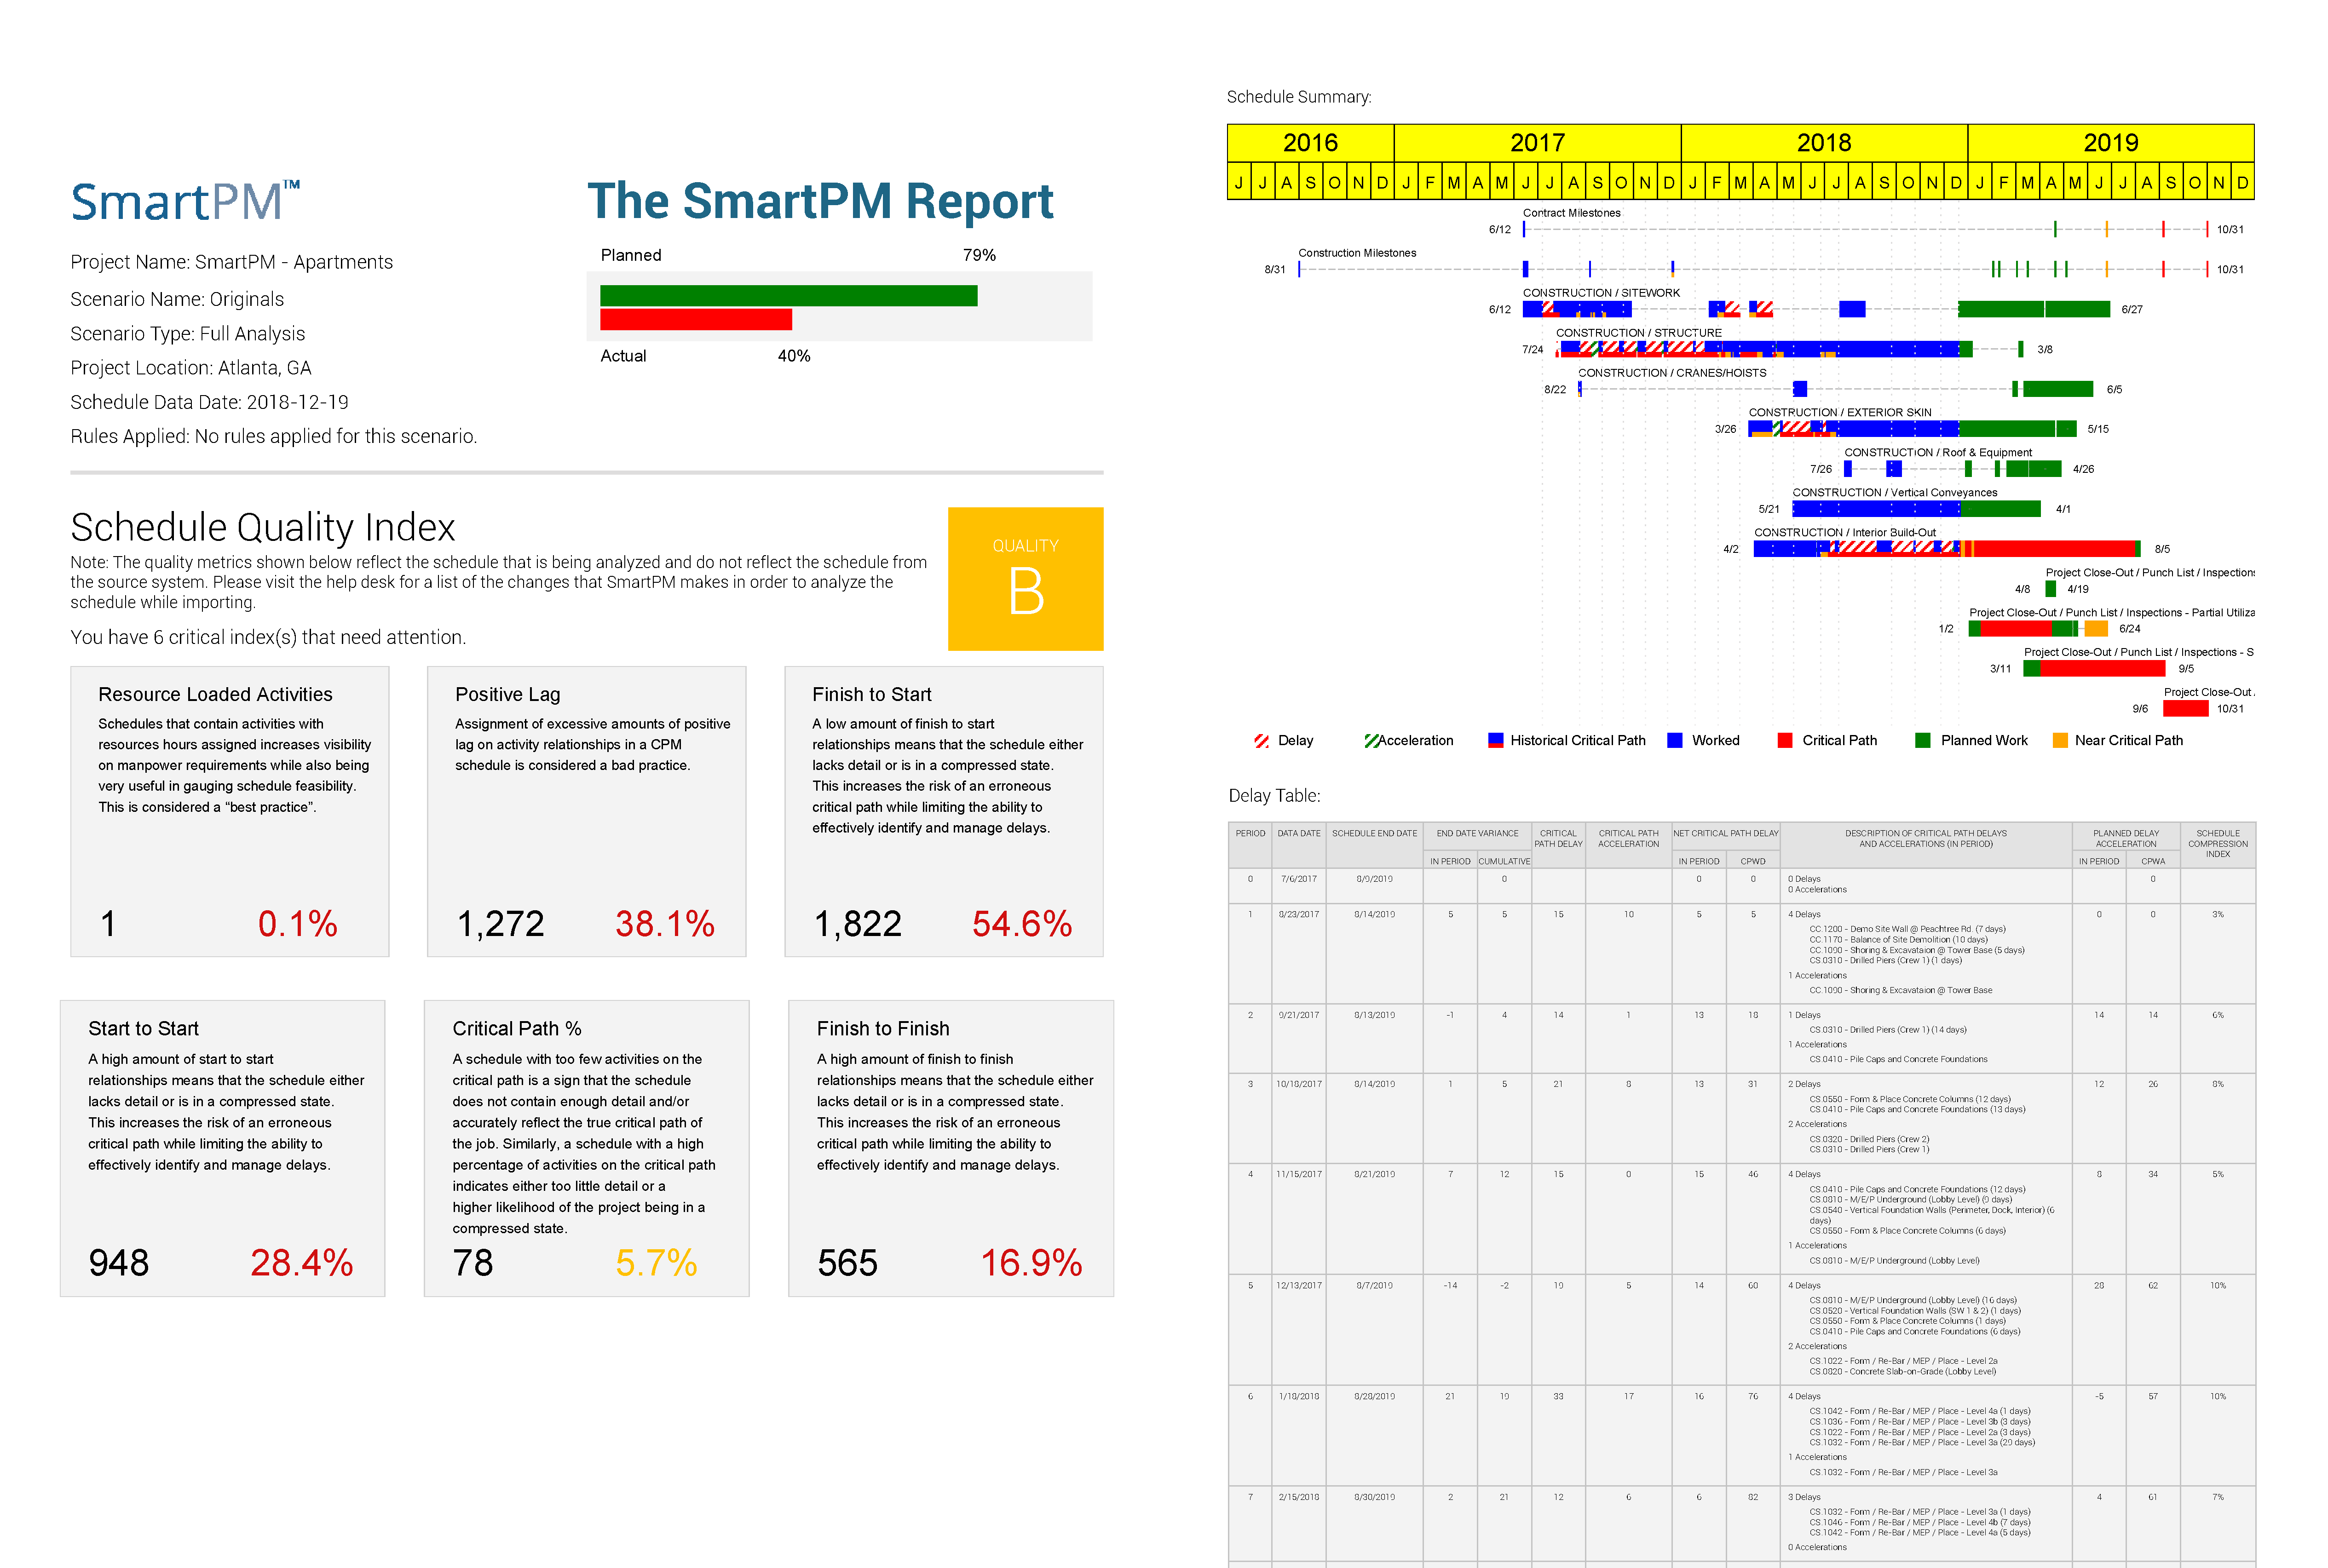
The SmartPM Report is an executive summary of the project to date that empowers you with the information you need in order to have the appropriate conversation with your leadership team or contractors.
OAC meetings are more efficient, productive and meaningful with the SmartPM Report.
Click to enlarge
Filter
.

The filter toggle enables the user to set up filters on the dashboard to show a subset of projects based on the filters criteria.
Add New Project
.

The Add New Project button enables the user to add a new project by importing a new project schedule, deeming it the “baseline” schedule.
Quality Checker

The schedule quality checker is a tool that you can load any schedule into to get your schedule's quality without having to load it into a project. This will give customers the ability to "check" their schedules and fix them before actually incorporating them into their project for the whole world to see. The Schedule Quality checker includes the Schedule Quality Excel Export and PDF print off of the schedule quality tab.
Ready to get started?
Reach a whole new level of data-driven decision making


Maximize Efficiency with SmartPM’s Project Controls Dashboard
Executive Dashboard at a Glance:
Effortlessly navigate through your entire portfolio. From high-level overviews to granular details of each project, gain insights that drive smart decisions.
Organizational Health and Quality Tracking:
Keep a pulse on your project’s health and schedule integrity, ensuring peak performance at all organizational levels.
Centralized Project Workspace:
Manage every project milestone with precision. Define, plan, track, and monitor your project from a centralized hub.
Proactive Delay Analysis:
Stay ahead of potential setbacks. Our automated tools help you identify and tackle delays before they impact your project’s trajectory.
Comprehensive Reporting:
Your projects are unique, and so are your reporting needs. Get reports to fit your specific requirements.
Smart Project Management Redefined with SmartPM’s Project Controls Dashboard
